Documentation Index
Fetch the complete documentation index at: https://porter-mintlify-elasticache-instance-specs-1778611231.mintlify.app/llms.txt
Use this file to discover all available pages before exploring further.
Custom Metrics Autoscaling
Porter supports autoscaling based on custom Prometheus metrics, allowing you to scale your services based on application-specific signals like queue length, request latency, or business metrics. For other autoscaling options, see the Autoscaling overview.Configuring Metrics Scraping
Note: Metrics scraping is only available for web services. You can configure Porter to scrape metrics from your application’s/metrics endpoint. This is useful for:
- Collecting application-specific metrics
- Setting up custom autoscaling based on your metrics
- Monitoring application performance
How to Enable Metrics Scraping
- Navigate to your application dashboard
- Select your web service
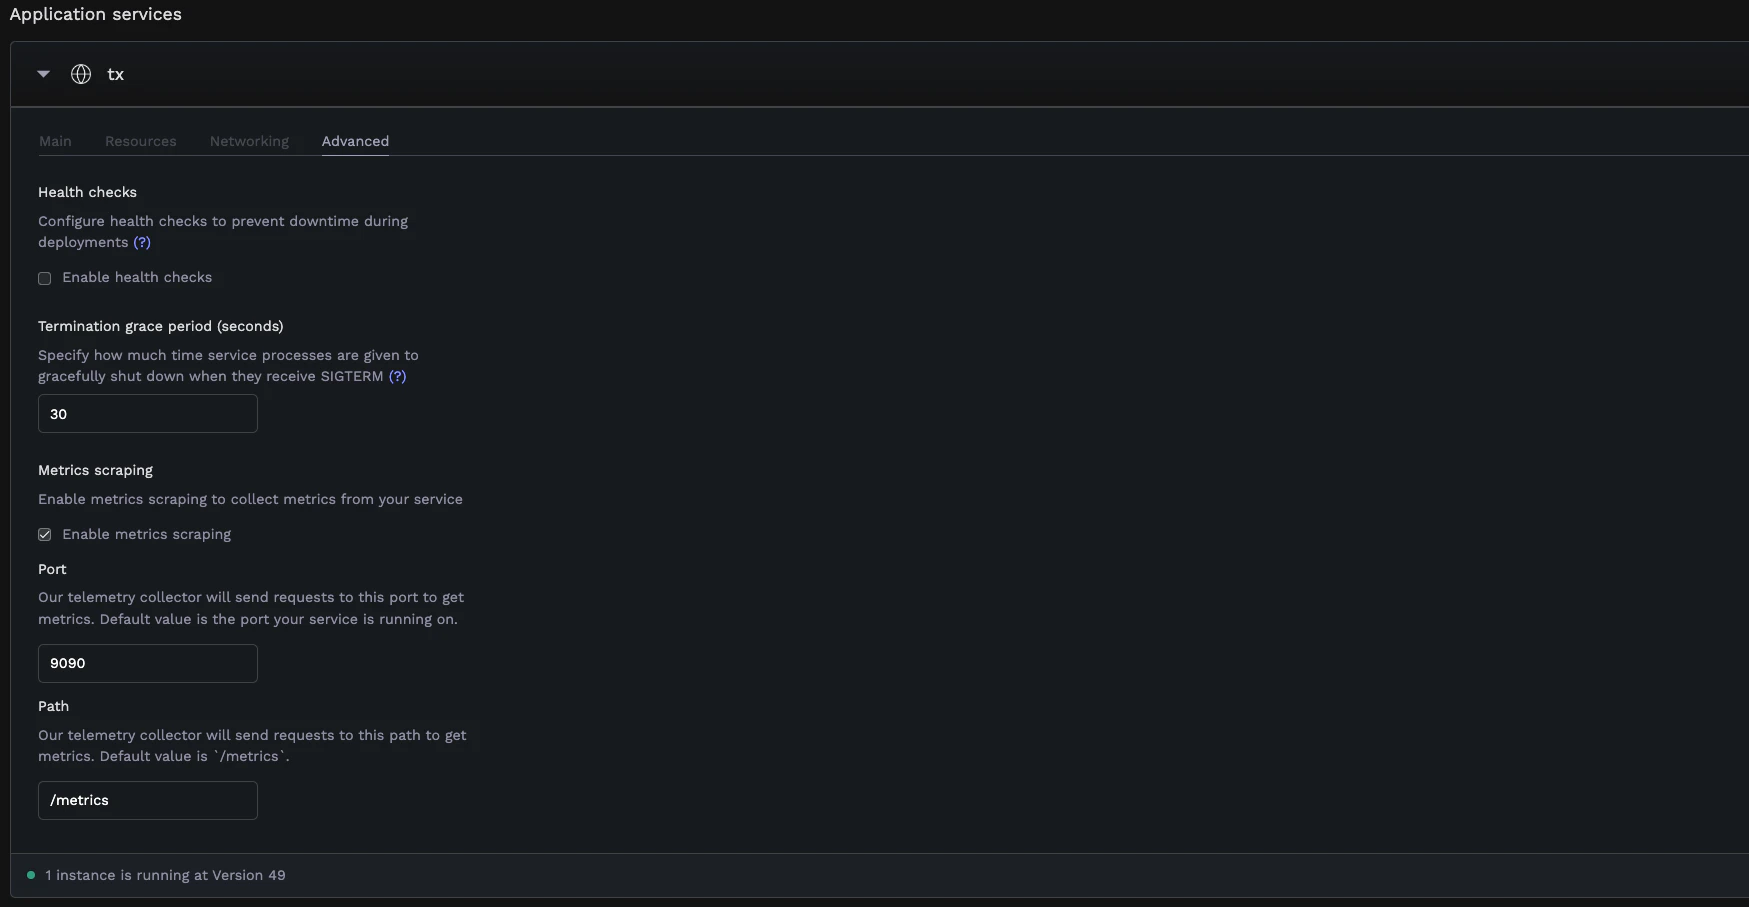
- Go to the Advanced tab under service settings
- Find the Metrics scraping section
- Enable Enable metrics scraping
- Configure the following options:
- Port: The port where your metrics endpoint is exposed (defaults to your web service’s default port)
- Path: The path where metrics are exposed (defaults to
/metrics)
Prometheus Metrics Format
Your application must expose metrics in Prometheus format:- Metrics are exposed as HTTP endpoints (typically
/metrics) - Each metric follows the format:
metric_name{label1="value1",label2="value2"} value - Common metric types:
- Counter: Values that only increase (e.g.,
http_requests_total) - Gauge: Values that can go up and down (e.g.,
queue_length) - Histogram: Observations distributed into buckets (e.g.,
request_duration_seconds)
- Counter: Values that only increase (e.g.,
Configuring Custom Autoscaling
With metrics scraping enabled, you can set up autoscaling based on your custom metrics.How to Configure
- Navigate to your application dashboard
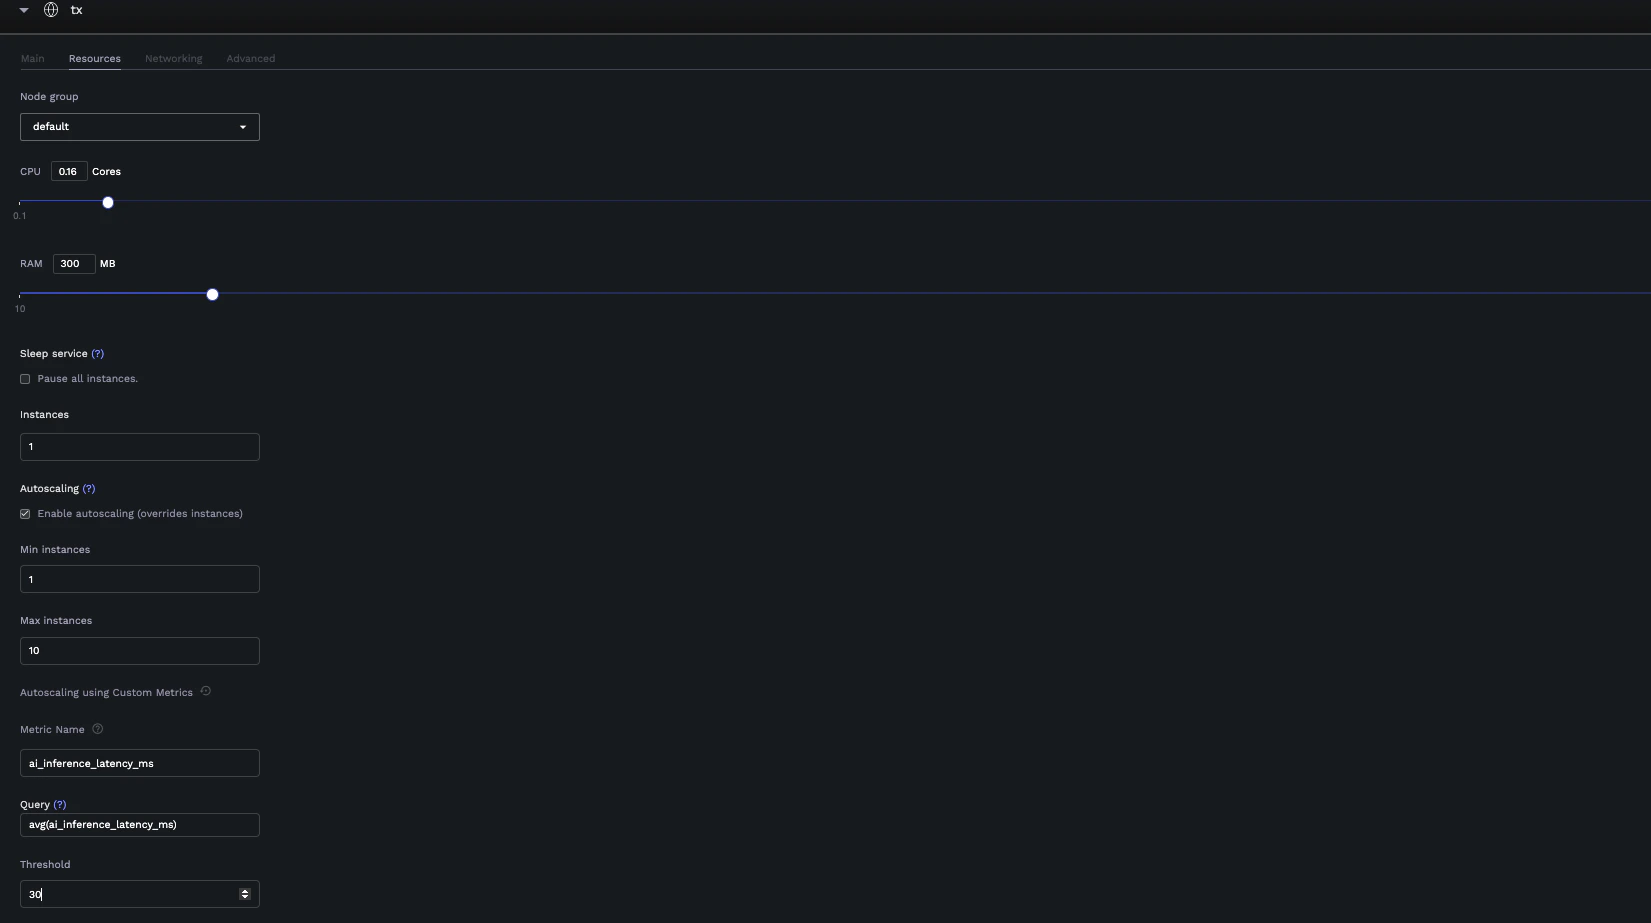
- Select your service
- Go to the Resources tab
- Configure basic autoscaling:
- Enable Autoscaling
- Set Min instances (e.g., 1)
- Set Max instances (e.g., 10)
- Switch to custom metrics mode by clicking the customize icon
- Configure custom metrics:
- Metric Name: Select a metric from your exposed Prometheus metrics
- Query: Write or modify the PromQL query (defaults to
avg(<metric_name>)) - Threshold: Set the threshold value that triggers scaling
Query Requirements
Your PromQL query must return a single numeric value (scalar). Valid query examples:avg(metric_name)→ Returns a single average valuesum(rate(http_requests_total[5m]))→ Returns a single sum valuemax(queue_length)→ Returns a single maximum value
- Vector results (multiple time series)
- String results
- No data/empty results
avg(), sum(), or max() to reduce it to a single value.
Switching Between Autoscaling Modes
You can switch between:- Default Mode: Autoscale based on CPU/Memory usage
- Custom Mode: Autoscale based on your application metrics
Example: Message Queue Consumer
Consider a data processing pipeline with a web API and worker service:Analytics Ingestion API
A web service that ingests events and publishes them to RabbitMQ for processing.Event Processing Worker
A worker service that processes events from RabbitMQ. Custom Autoscaling Configuration:- Metric Name:
rabbitmq_queue_messages{queue_name="user_events"} - Query:
sum(rabbitmq_queue_messages{queue_name="user_events"}) - Threshold:
1000(scale up when more than 1000 events are waiting)